GIS Information and Resources
Geographic Information Systems and Science utilizes layers of data to analyse the world around us. Many of these layers are open source and available for free. This page aims to highlight resources available for GIS data related to stormwater and trees in the semi-arid high desert region of Northern New Mexico. It is by no means complete — open source data is continually being created, and collaboration is key! Feel free to make best use of these data sources.
From contour lines to soil types, and even tree data from the Santa Fe Public Spaces Tree Inventory, layers build upon each other to understand not only what grows well where, but also…
…how Santa Feans can plan now for a livable tomorrow.
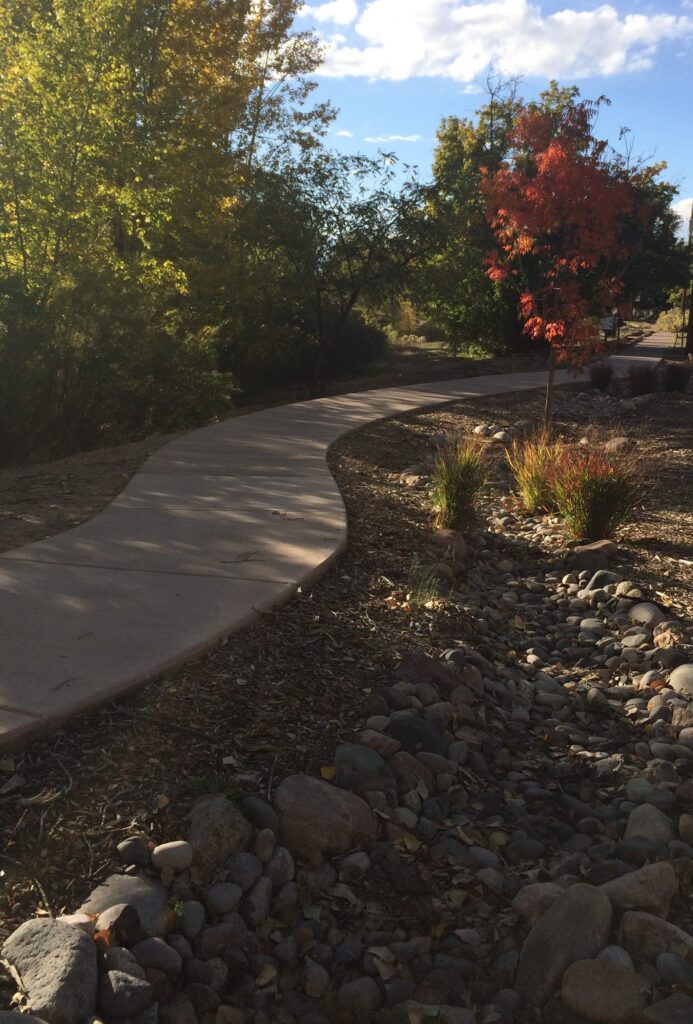
Trees provide many ecosystem services, including protection from storm water runoff. In Santa Fe, NM, where we are lucky to receive 14″ of rainfall a year, storm water is made into a resource to help grow our urban canopy. By applying water harvesting strategies across the city and county, we will grow our forest and avoid the deleterious effects of unharnessed storm water. Utilizing Geographic Information Systems and Science is a way to map and analyze where land can be dedicated for this effort. Large intact parcels, often called urban forest core areas or hubs, will provide the most ecosystem services. Factoring in slope, soil type, and soil erosivity factors will elucidate where water is built to spill and capture is needed to prevent sedimentation in waterways. Finally, plant selection requires detailed knowledge of what does well and where. By planning now, Santa Fe can protect these spaces, utilize their value, and provide green space for the health of our environment and our citizens.
Below are resources including database portals, toolkits, shapefiles, and scholarly articles pertinent to linking stormwater harvesting with trees and urban forestry hubs.
Resource Geographic Information System (RGIS)
The Resource Geographic Information System (RGIS) site has an advanced data portal. It offers a wide array of datasets, mainly through zip files. With so many datasets to choose from, having a quick and easy download method will speed up research. An attractive filter allows for quick access to a variety of themes, and some some files are listed with file type attributes.
Examples of available shape files include:
The “soil_nm687_2013” zip folder offers many soil type shape files. However it is slow to load. The polygons are detailed, which may aid in research geared toward this specific factor in stormwater use.
“New Mexico parks” provides park locations as point vectors.
One especially useful shapefile is “General Vegetation”. It contains vector polygons of vegetation including: desert grassland, montane grassland, juniper savanna, coniferous (mixed and subalpine), and urban. This shapefile will prove useful for urban forestry designers in order to select best plant material for the design site across a large area.
Resource Geographic Information System. 2015. Get Data. University of New Mexico (Albuquerque): Earth Data Analysis Center. Available at: https://rgis.unm.edu
A GIS based screening tool
(article)
Primary layers for storm water harvesting mapping are elucidated in the article “A GIS based screening tool for locating and ranking of suitable stormwater harvesting sites in urban areas”. The recommended layers include a “runoff layer, the demand layer and the catchment layer”. This simplifies the initial assessment of stormwater harvesting sites by breaking it down into demand for the site, the amount of runoff in relation to the demand, and the distance required for stormwater to travel to reach the site. By incorporating these GIS layers, including 10m digital elevation models (DEMs), sites can be evaluated and ranked according to priority for utilizing stormwater runoff for the highest benefit. This ranking is a two step process of first setting the thresholds and second shortlisting the sites. The process allows for a clear and measurable approach to “provide a combined set of stormwater harvesting sites with high demand, high ratio of runoff to demand and less weighted distance”.
Inamdar PM, Cook S, Sharma A, Corby N, O’Connor J, Perera BJC. 2013. A GIS based screening tool for locating and ranking of suitable stormwater harvesting sites in urban areas. Journal of Environmental Management, v 128. p 363-370. Available at: https://www.sciencedirect.com/science/article/abs/pii/S0301479713003514
City GIS Portal
The City of Santa Fe offers a web based intuitive GIS portal with a wide range of layers that can build a personalized map even with a tablet. This will be useful to bring into the storm water and trees project by ascertaining city owned land, existing bike ways, city parks and dedicated open space. These data will help determine more immediately available properties for city sponsored work, as well as analyze areas where the need for urban forestry core areas are lacking. Bike trails often make reliable and maintained corridors between core areas.
GIS Section. n.d. Create Your Own Map. City of Santa Fe (NM): Information, Technology & Telecommunications. Available at: https://www.santafenm.gov/gis
Geocortex
Geocortex is the platform on which City of Santa Fe provides their map. Geocortex is changing how people interact with multiple data, by providing a workflow of layers that is easy to use and customizable for the end user. Additionally, the software brings ESRI ArcGIS platform updates into action, which eliminates outdated information. It makes it possible to provide beautiful, interactive content for very broad or very specific use. Geocortex allows departments to communicate and utilize each other’s layers seamlessly. This software makes it possible to talk trees across a diverse audience. It would also make it possible create a similar map system for layers pertaining to storm water and trees.
Geocortex. 2017. Geocortex complements Esri’s modern Web GIS pattern and ArcGIS platform. Latitude Geographics Group Ltd. Available at: http://www.geocortex.com/
Green Infrastructure
Core Area Toolkit
Being able to develop locations for Urban Forestry core areas or ‘hubs’ is no easy task. It involves careful analysis of multiple other layers, including property boundaries, corridor locations, site sizes, and animal migration patterns. The Green Infrastructure, Inc. has collaborated with ESRI to create a toolkit to help automate some of these queries, which can be uploaded through ArcGIS platform and added to the user’s toolkit. The toolkit features tools for corridor analysis and creation of hubs, making it possible move beyond the theoretical framework of green infrastructure planning.
The Green Infrastructure, Inc. 2016. Green Infrastructure Center Model for ArcGIS Pro. ESRI. Available at: http://nation.maps.arcgis.com/home/item.html?id=386df801cdb849b087a76c8b959066a3
Green Infrastructure
Guidebook
Karen Firehock, director and co-founder of The Green Infrastructure, Inc., developed a multi-scale guide to help communities become strategic about their green infrastructure planning. Maps and layers she especially recommends to garner community engagement include: existing forests, recharge areas, landscapes around historic areas, working farms, hiking trails and recreation areas, landscape features, and wildlife corridors. In this way, maps connect to locals, who will feel more connected to the areas for preservation or reclamation.
She encourages the use of technologies to find out how best a community can actually be served, instead of simply through hypothetical scenarios. By utilizing the guide, a community can take a methodological approach to cataloging, evaluating, and prioritizing their green assets, as well as “providing the steps for determining how to facilitate development in ways that reduce its impact on the landscape.”
Firehock K. 2015. Strategic Green Infrastructure Planning: a Multi-scale Approach. Green Infrastructure Center. Charlottesville (NC): Island Press. Available at: https://islandpress.org/book/strategic-green-infrastructure-planning
Value of Hubs
Large parcels of land provide intact forest centers. These core areas or hubs offer undisturbed areas for animals, amplify the capacity for storm water mitigation, and enhance biodiversity. This article makes an example of Cecil County in Maryland by quantifying the value of hubs. As Ted Weber writes, “large contiguous blocks of forests and wetlands *i.e., Green Infrastructure hubs) are more likely to contain fully functioning ecosystems, and more likely to provide corresponding values to humans. Protection of these areas is therefore a vital investment”.
The research exemplifies runoff values and particulate removal, such as heavy metals, pesticides, and toxins eliminated through forests. It emphasizes soil stabilization through vegetation, which is an issue inherent in the desertified slopes of northern New Mexico. It takes the ‘good idea’ of urban forest hubs into quantifiable statistics of environmental quality and urban livability.
Weber T. 2007 December. Ecosystem services in Cecil County’s Green Infrastructure: Technical Report for the Cecil County Green Infrastructure Plan. Annapolis (MD): The Conservation Fund. Available at: https://www.academia.edu/4229155/Ecosystem_services_in_Cecil_County_s_Green_Infrastructure_Technical_Report_for_the_Cecil_County_Green_Infrastructure_Plan
Santa Fe County GIS
Green Infrastructure does not begin at the city boundary. It incorporates the surrounding county, especially upland, where vegetated forest cover protects the watershed. Also, Santa Fe is a city within a forest, at the foothills of the Sangre de Cristo Mountains. County data brings together recreational activities and locations from which city corridors can begin and end. It is through collaboration between agencies that Green Infrastructure works best. By incorporating county data into city projects, the best designs can be developed.
Santa Fe County is working on an interactive map portal. The trails map provides good information for corridor trailheads. Also available through the county are dwg files for urban forestry designers.
Santa Fe County. 2017. Santa Fe County Interactive Trails Map. Santa Fe (NM): Geographic Information Systems. Available at: http://santafecountynm.maps.arcgis.com/apps/MapSeries/index.html?appid=494e97891d524635936a5b9b759d7c63
2050 Land Cover Prediction
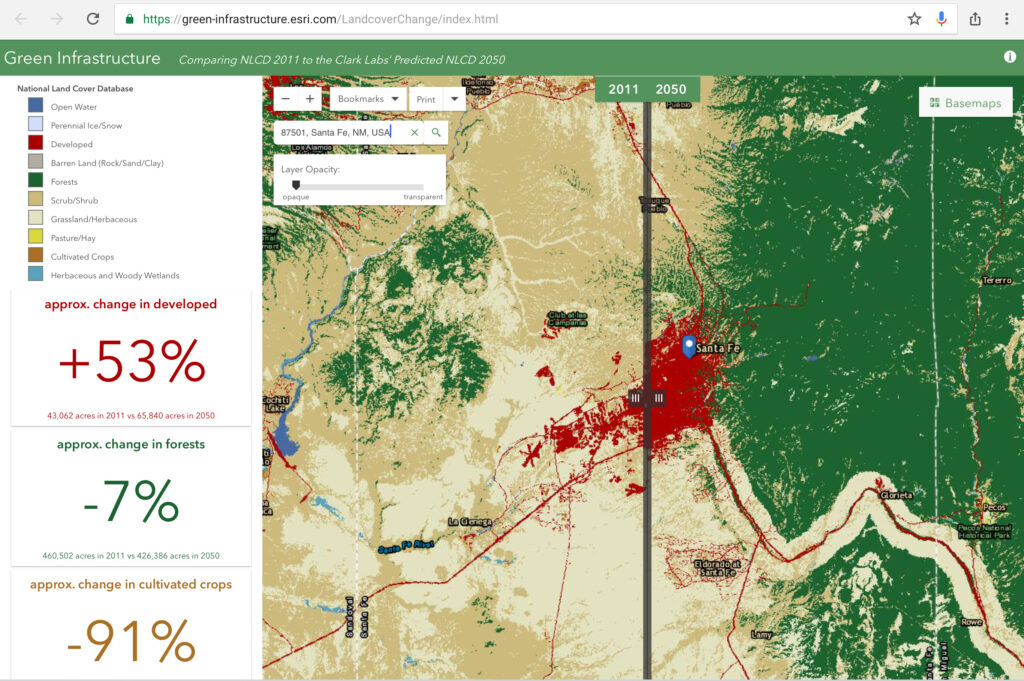
Clark Labs created a comparative map representing predicted changes in land cover base from 2011 to 2050. Predictive modeling software, current land cover data, and many variables were utilized for the development of this visually stimulating model. Variables include: elevation, slope, proximity to features such as roads, water & cropland, and protected areas. The only user data needed is a zip code, and the split screen offers the end user an opportunity to compare between actual and predicted.
Here photographed is the split screen for Santa Fe. It estimates 53% increase in developed land, which basically turns the entire city to red. This model is clear, user friendly, and makes poignant the need to plan urban forest core area locations before and in conjunction with development.
Clark Labs. 2016. The Clark Labs 2050 Conterminous US Land Cover Prediction. Available at: https://livingatlas.arcgis.com/landcover-2050/
Analysis Tool for
Comparing Land Cover
Clark Labs, through Clark University, has developed a suite called TerrSet Geospatial Monitoring and Modeling System, which offers a wide array of applications for GIS integration. Models of particular interest for landscape design include the habitat model, which includes a corridor tool, and the land use change model.
“Land cover change represents one of the major threats to biodiversity worldwide. Habitat destruction is the dominant threat. One must therefore integrate land cover change maps with species distribution data to inform conservation strategies” (Land Use brochure).
The set allows for intelligent and timely design. By incorporating species needs, land use planning can work within the boundaries of a healthy ecosystem for a species-rich city. By recognizing the trends in land use, the community can make decision to reduce forest edge effects. Analysis tools such as these will make it possible.
Clark Labs. 2015. TerrSet: Geospatial Monitoring and Modeling System. Worchester (MA): Clark University. Available through: www.clarklabs.org
Land Use Change Modeler Brochure: http://clarklabs.org/wp-content/uploads/2015/06/Land-Change-Modeler-ArcGIS-Software-Brochure.pdf
TerrSet Brochure: https://clarklabs.org/wp-content/uploads/2016/03/TerrSet18-2_Brochure_WEB.pdf
EPA Stormwater Toolkit
The Environmental Protection Agency is working with Santa Fe on a personalized stormwater toolkit. The agency is providing support and training for this kit in order to facilitate a thorough stormwater plan. A macro-enabled spreadsheet is currently available for download through the EPA, which helps calculate user data relating to hydraulic conditions, water flow data, and potable demand. By incorporating data into the spreadsheet, flows are charted allowing for monthly target streamflow to be ascertained and planned.
Environmental Protection Agency. 2017. WMOST v2.0 Install Files.
https://www.epa.gov/exposure-assessment-models/wmost-20-download-page
USGS
United States Geological Survey provides many data for analysis, including contour line and digital elevation models (DEM). Some data are available as ArcGIS maps. One nice feature is the formats filter, which makes it a lot easier to find files that can be imported into an ArcGIS Map for relationship analysis. These layers are needed for slope analysis, which contributes to velocity of storm water, as well as potential for soil erosion.
United States Geological Survey. n.d. Data Catalog. Data.gov. Available at: https://catalog.data.gov/organization/usgs-gov
Cerro Grande Fire Erosion
(article)
The Cerro Grande Fire in northern New Mexico in May 2000 reached such high temperatures, that soils became hydrophobic as well as denuded of vegetation. This resulted in a dramatic increase in soil loss through erosion after rainfall events. Miller, Nyhan and Yool utilized the Revised Universal Soil Loss Equation (RUSLE) to model this in a GIS platform. They “demonstrate a method of deriving estimates of soil erosion that can be used in post-fire erosion risk analysis”. By utilizing good data and this calculation, hillside erosion and total soil loss can be calculated and illustrated.
Miller J, Nyhan J, and Yool S. 2003. Modeling potential erosion due to the Cerro Grande Fire with a GIS-based implementation of the Revised Universal Soil Loss Equation. International Journal of Wildland Fire, v12. pp85-100. Available at: https://www.publish.csiro.au/wf/WF02017
Santa Fe Public Spaces
Tree Inventory
The Santa Fe Municipal Tree Board has been working with volunteers especially through the Santa Fe Master Gardener Association to inventory trees in parks. As of Dec. 2017, 12 parks have been inventoried. Global Positioning System (GPS) data was acquired from five of those parks: Harvey Cornell Rose Park, Alto/ Bicentennial Park, Torreon Park, Franklin Miles Park, and Tommy Maccione Park. The tree data and location is now visible through the city GIS department website. These data help elucidate which tree species are doing well in current climate and care conditions. They will also provide a valuable base point for any future queries, such as by-year comparisons of locations where storm water is harvested, climate change, and pest infestation.
In addition, ecosystem service reports for the parks, developed through iTree Eco, are available through Seeds of Wisdom, LLC. These will soon be linked to this site for easy access. iTree Eco is a free inventory software program for ecosystem benefits from trees.
An analysis report details 2016 data, as well as provides recommendations for improving the Santa Fe urban forest. It explains the issues the semi-arid canopy is facing, as well as highlights existing trends and mitigation techniques.
Beshur A. 2017. Santa Fe Public Open Spaces Tree Inventory Report on 2015-2016 Results. Santa Fe (NM): Seeds of Wisdom, LLC. Available at: https://sowsfe.com/product/2016_santa_fe_tree_inventory_analysis/
iTree Eco. 2017. iTree Desktop Suite. Download available at: https://www.itreetools.org/tools.php
TreeSmart Santa Fe. 2017. Tree Plotter NM GIS. Layer available at:
https://treesmart-thecitydifferent.hub.arcgis.com/pages/resources
Trees
A major aspect of tree selection is retaining diversity in the area. Knowing what plants are under attack by pests, which microclimates are best suited for particular species, and what the individual water needs of each plant are requires years of practical research. But the reality is that Santa Fe needs to start planting now and planting often. Storm water can be used as a primary water source once plants are established. There are several resources and databases available to help understand the nuances of each species needs, but the best resource of all is observation. Observation can be found through looking up at the canopy cover of a tree, looking around to see what insects populate the tree, and looking down to see how the soil holds moisture and the effect that has on the overall health of a tree.
In northern New Mexico, many factors need considering to choose the best plant. As such, learning through multiple resources will provide a comprehensive grasp on which plants do well. One useful database for tree selection is provided by the Office of the State Engineer. It provides search criteria to incorporate as many variables as possible.
Office of the State Engineer. 2011. New Mexico Plant List. Office of the State Engineer (NM). Available at: https://www.ose.nm.gov/WUC/plant_list.php
Another, much more abbreviated list, is offered by Tree New Mexico, which has links to data sheets for each selection.
Tree New Mexico. 2017. Recommended Tree Planting List. Available at: https://treenm.org/2021/01/28/climate-ready-trees-report/